VAC-6V Volume Analyzer & Controller
Product Info
VAC-6V is a free and open source VST (2.4 and 3) and Audio Unit plugin which lets you analyze and control the peak volume of a signal.Main Features
- main LCD screen shows peak volume history as a bar graph
- can be paused, scrolled and zoomed
- 3 displays show peak volume as a numeric value (in dB)
- represents hard clipping and (adjustable) soft clipping
- adjust the gain
Look & Feel
Installation
Download the plugin, unpack and follow the instructions in the included README.txt file. At this time, the plugin is available for macOS (Intel and Apple) and Windows 64 bits and works in any DAW supporting any of the VST2, VST3 or Audio Unit formats.Features
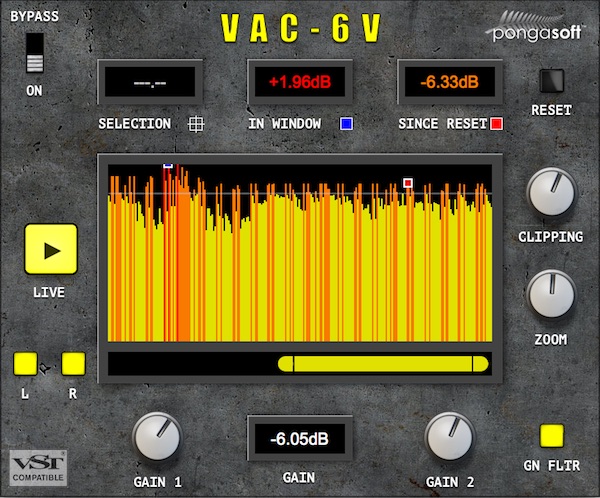
Volume analyzer (peak levels): Main LCD
- the main LCD screen shows the peak volume history as a bar graph
- can be paused, scrolled and zoomed
- can be selected to analyze a particular point
- shows hard clipping (as a red line) and (adjustable) soft clipping (as an orange line)
- can separately show the left or right channel (by default combined)
- The soft clipping level is a threshold that you choose. It has no effect on the sound itself. It simply gets represented with an orange line in the graph or orange text in the display(s).
- The hard clipping level is fixed at 0dB. If your signal goes beyond this threshold, it will usually introduce distortion since the sound gets clipped. That being said, most DAWs internally do not clip the sound until Master out, so you may have individual tracks that are reaching beyond 0dB and yet have Master out not clipping (check this really good video about this topic). It is represented as a red line in the graph or red text in the display(s).
Soft clipping vs Hard clipping
Volume analyzer (peak levels): Numeric displays
- 3 displays show the peak volume as a numeric value (in dB)
- SELECTION: shows the value selected on the main display (use mouse to select)
- IN WINDOW: shows the peak value in the main LCD window (toggle the marker by clicking on the blue square below the window)
- SINCE RESET: shows the peak value since reset was pressed (toggle the marker by clicking on the red square below the window)
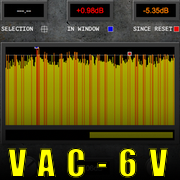
- shows hard clipping (ex: +0.98dB) and (adjustable) soft clipping (ex: -5.35dB).
Volume controller
- 2 volume knobs lets you control the volume/gain
- fully automatable
- Gain Filter allows for smooth change in volume (can be turned off)
Why 2?
Having 2 volume knobs allow you to, for example, use one knob to set an overral level and use the other one for automation only. That way if later on you need to change the overral level, you can simply tweak the one that is not automated while preserving the automation.
Bypass
- Since the device is an effect, it can be bypassed. When the device is bypassed, the input signal is no longer affected by the Gain knobs and the displays and LCD show the original signal. Note how the Gain window gets greyed out and shows +0.00dB in this case.
Technical details
This section can be skipped and is of interest only if you care about some of the internal details of implementation. You can check the code for further details since it is open source.Algorithm
At a high level, the algorithm is accumulating audio samples (per channel) and keeping the absolute max to represent a column in the graph. The number of samples accumulated depends on the zoom level. The formula to convert the max to a dB value is the standard one:valueInDB = 20 * log10(abs(valueInSample));Zoom
When completely zoomed in, every bar/column in the bar graph represents 5ms of accumulated samples (the number of samples varies with the frame rate). Since there are 256 columns in the graph, the window represents 1.28s of accumulated samples.Sponsor
pongasoft produces a variety of high-quality and free/open source software. If you would like to support my work and help offset the cost of development tools, web hosting, etc., here is how to do so:
- Tip via Ko-fi
- Send money via PayPal
News
VAC-6V2026-02-09
- The project has been moved to Codeberg.
Old News
1.2.1 - 2020-01-04
- Added support for Apple Chipset / universal build on macOS
1.2.0 - 2019-01-03
- Tweaks to the scrollbar (now includes zoom handles)
1.1.0 - 2018/10/06
- Added Audio Unit support (macOS)
1.0.0 - 2018/07/16
- First release